As promised, I turned my Twitter sentiment analysis tool on the big TV/social web phenomenon that is the X-Factor. I started the script running at around 6:30pm and off again at 10:30pm — but the really interesting bit is during the show itself (thankfully watching the results stream in meant I didn’t have to watch the show itself).
It ran every minute and looked at the most recent 1,000 tweets tagged #xfactor.
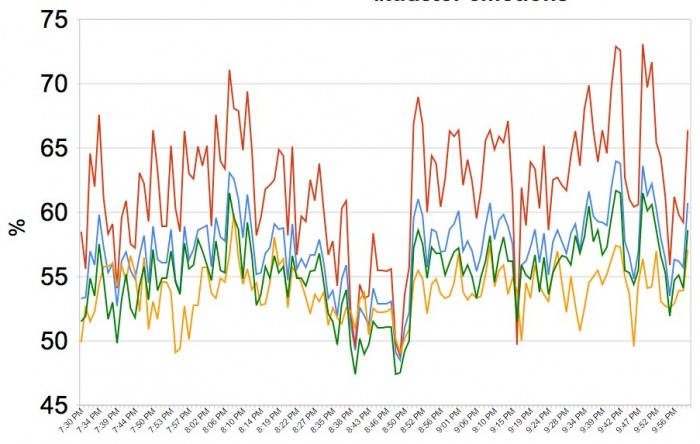
 The real reason for using the X-Factor is that I was aware just how violently the emotions can swing on Twitter when watching—and also it is a very defined timeline of events. The Valence (the happy-sad ratio, red line) had greater peaks and troughs in short times than any sentiment graphing project I’ve tried before.
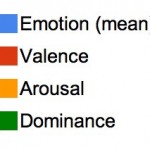
The differences are far more prominent in the graph than any trends over the whole two and a half hours. Arousal (awake-ness, for want of a better word) was relatively constant, as was dominance (the feeling of control), although both jump up and down (within boundaries) along with Valence.
And who was ever-so unpopular around 8:50pm? This chap:
Next, I think I’ll try Question Time.


Comments are closed